使用pudb调试华为mindspeed系列框架代码
·
背景:mindspeed-llm/rl框架无法通过pycharm 连ssh 解释器进行调试(报环境变量等问题),经实验,通过pudb能较好的解决此问题。
1、安装pudb
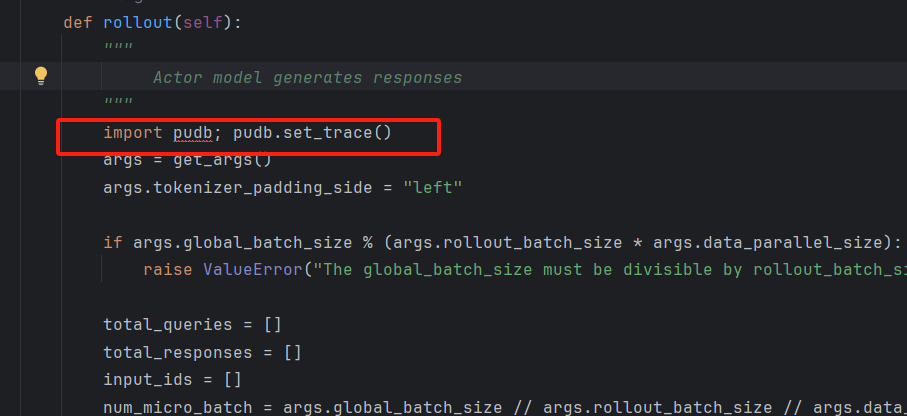
pip install pudb2、在需要添加断点的位置插入此行
3、修改sh启动脚本
将examples/mcore/xx目录下需要启动的脚本进行修改,去掉
| tee logs/trl_ppo_llama32_1b.log部分
备注:
(1)若不去掉| tee管道处理,会导致pudb窗口比例有问题
(2)不要在torchrun中增加 -m pudb参数,否则会导致显卡加载等异常
可调试的的脚本文件格式如下:
DATA_ARGS="
    --dataset_additional_keys labels \
    --data-path $DATA_PATH \
    --split 100,0,0
"

torchrun $DISTRIBUTED_ARGS posttrain_gpt.py \
    $GPT_ARGS \
    $OUTPUT_ARGS \
    $DATA_ARGS \
    $MLA_ARGS \
    $ROPE_ARGS \
    $RL_ARGS \
    $PROFILE_ARGS \
    --tokenizer-not-use-fast \
    --distributed-backend nccl \
    --ref-model ${SFT_LOAD_DIR} \
    --reward-model ${REWARD_LOAD_DIR} \
    --save ${CKPT_SAVE_DIR}
4、启动调试
在pycharm中tools->Start SSH Session 新建ssh终端(网页终端也可以,可从autodl实例中jupyter lab进入),执行:
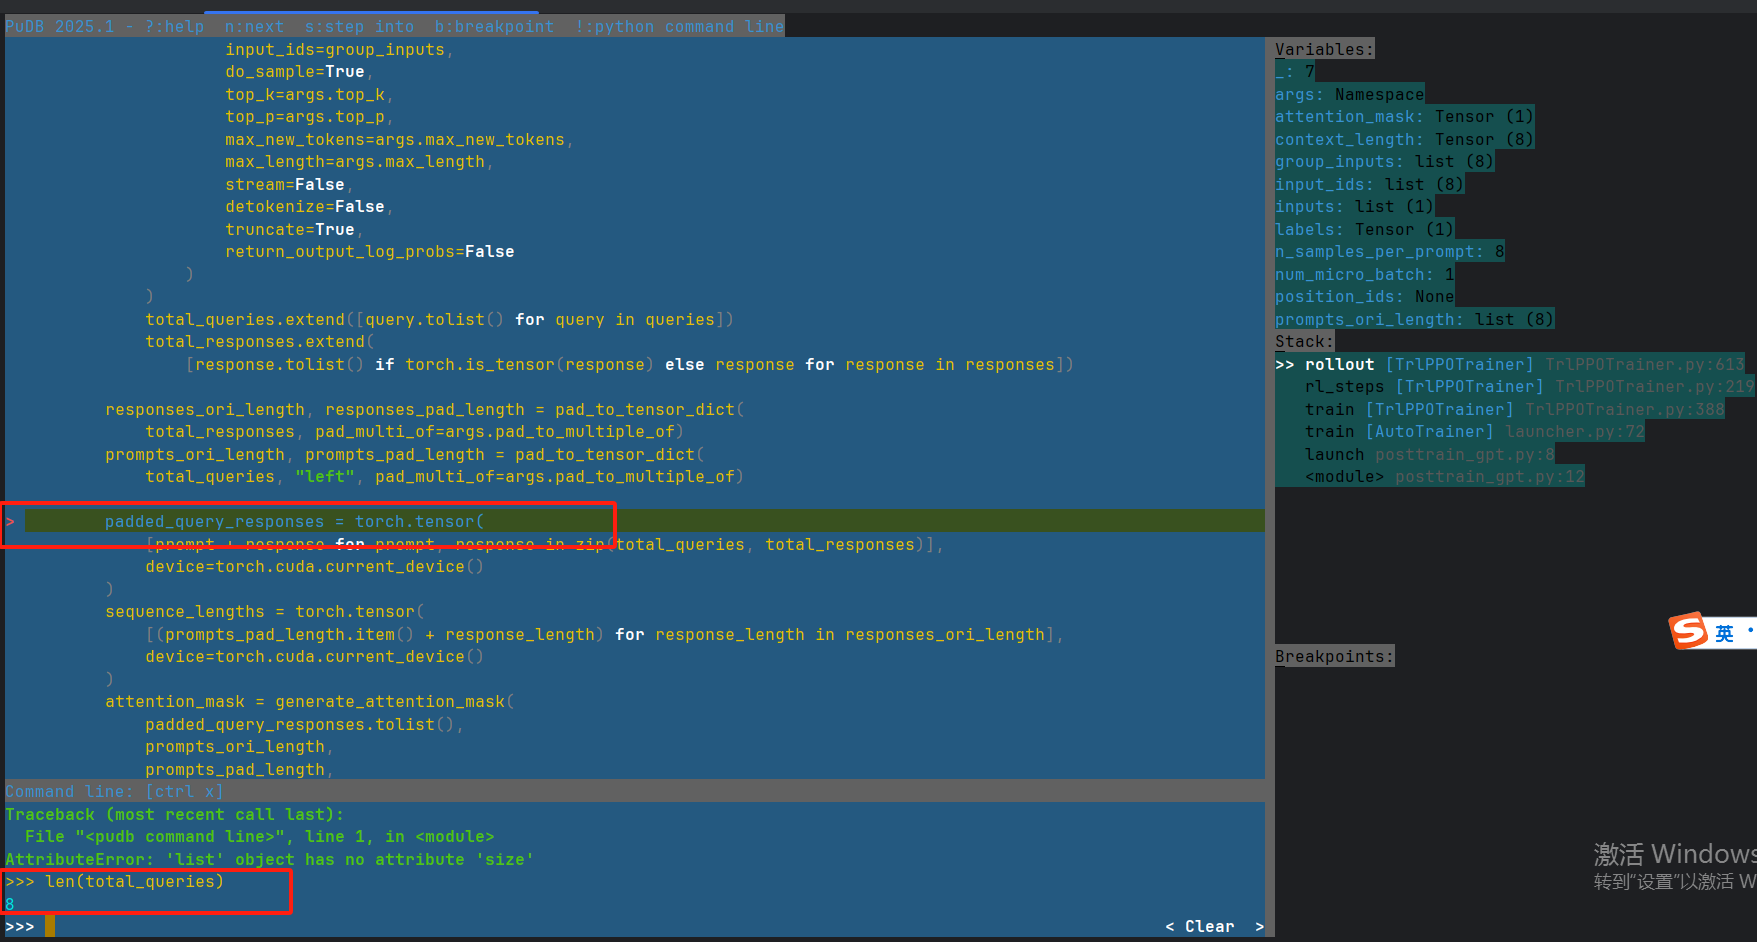
sh examples/mcore/llama32/xx.sh可以看到如下页面
5、pudb快捷键介绍
常见快捷键:
n:next,单步调试
s: step info,进入函数
d: down,深入函数层级
u: up,返回上一层级
ctrl +x:进入python当前上下文解释器模式,可输入查看变量,如len(total_queries),会打印8,再次执行ctrl +x 回到调试窗口
q:可退出调试
更多使用说明:感觉挺方便
Welcome to PuDB, the Python Urwid debugger.
-------------------------------------------

(This help screen is scrollable. Hit Page Down to see more.)

Keys:                                                          # 快捷键相关
    Ctrl-p - edit preferences                                  # 编辑配置

    n - step over ("next")                                     # 运行到下一行
    s - step into                                              # 运行进函数
    c - continue                                               # 继续运行
    r/f - finish current function                              # 结束当前函数
    t - run to cursor                                          # 运行到光标处
    e - show traceback [post-mortem or in exception state]     # 显示traceback

    H - move to current line (bottom of stack)                 # 移动到当前行(栈底)
    u - move up one stack frame                                # 移动到栈的上一行
    d - move down one stack frame                              # 移动到栈的下一行

    o - show console/output screen                             # 显示命令行屏幕(回车返回pudb)

    b - toggle breakpoint                                      # 打断点/取消断点
    m - open module                                            # 打开python模块

    j/k - up/down                                              # 上/下
    Ctrl-u/d - page up/down                                    # 上一页/下一页
    h/l - scroll left/right                                    # 左滚动/右滚动
    g/G - start/end                                            # 跳转到首行/末行
    L - show (file/line) location / go to line                 # 跳到指定行
    / - search                                                 # 查找
    ,/. - search next/previous                                 # 查找下一个/上一个

    V - focus variables                                        # 聚焦在变量窗口
    S - focus stack                                            # 聚焦在栈窗口
    B - focus breakpoint list                                  # 聚焦在断点列表窗口
    C - focus code                                             # 聚焦在代码窗口

    f1/?/H - show this help screen                             # 显示帮助窗口
    q - quit                                                   # 退出

    Ctrl-c - when in continue mode, break back to PuDB         # 当处于连续模式时,返回pudb

    Ctrl-l - redraw screen                                     # 重绘窗口

Command line-related:                                          # 命令行相关
    ! - invoke configured python command line in current environment  # 进入命令行窗口
    Ctrl-x - toggle inline command line focus                 # 切换命令行窗口和代码窗口

    +/- - grow/shrink inline command line (active in command line history)      # 增长/缩减命令行(命令行历史下激活)
    _/= - minimize/maximize inline command line (active in command line history)# 最小化/最大化命令行(命令行历史下激活)

    Ctrl-v - insert newline                                    # 插入新行
    Ctrl-n/p - browse command line history                     # 浏览命令行历史
    Tab - yes, there is (simple) tab completion                # 快速补齐

Sidebar-related (active in sidebar):                           # 工具栏相关(工具栏激活时有效)
    +/- - grow/shrink sidebar                                  # 扩大/缩减工具栏(指的是工具栏宽度)
    _/= - minimize/maximize sidebar                            # 最小化/最大化工具栏
    [/] - grow/shrink relative size of active sidebar box      # 扩大/缩减激活工具栏相对大小(指的是窗口高度)

Keys in variables list:                                        # 变量列表窗口的快捷键
    \ - expand/collapse                                        # 展开/收缩
    t/r/s/c - show type/repr/str/custom for this variable      # 切换type/repr/str/custom
    h - toggle highlighting                                    # 切换高亮
    @ - toggle repetition at top                               # 切换顶部重复
    * - cycle attribute visibility: public/_private/__dunder__ # 属性的循环可视化
    m - toggle method visibility                               # 切换方法的可见性
    w - toggle line wrapping                                   # 切换换行
    n/insert - add new watch expression                        # 添加新的watch表达式
    enter - edit options (also to delete)                      # 编辑选项

Keys in stack list:                                            # 栈列表窗口的快捷键

    enter - jump to frame                                      # 跳到某帧

Keys in breakpoints view:                                      # 断点列表窗口的快捷键

    enter - edit breakpoint                                    # 编辑断点
    d - delete breakpoint                                      # 删除断点
    e - enable/disable breakpoint                              # 启用/禁用断点

昇腾计算产业是基于昇腾系列(HUAWEI Ascend)处理器和基础软件构建的全栈 AI计算基础设施、行业应用及服务,https://devpress.csdn.net/organization/setting/general/146749包括昇腾系列处理器、系列硬件、CANN、AI计算框架、应用使能、开发工具链、管理运维工具、行业应用及服务等全产业链
更多推荐

 3
3 0
0- 0


 已为社区贡献2条内容

所有评论(0)